
In this article
Measure AI visibility by tracking a fixed set of customer questions, recording the answers and cited sources under documented conditions, and comparing those observations with referral and business outcomes; a single screenshot or website readiness score is not a reliable visibility measurement.
A useful report makes its scope obvious. A reader should be able to tell which services were checked, which questions were asked, when the observations happened, what counted as a mention or citation, and how missing responses were handled. Without that information, a percentage can look precise while describing almost nothing.
This guide provides a practical measurement framework for a small business or agency. The numerical examples are transparent calculations, not customer results. The workflow does not claim to reveal private ranking systems or establish a permanent position in ChatGPT, Claude, Gemini, or another assistant.
Start by separating three kinds of measurement
Website readiness, observed AI visibility, and business performance answer different questions. A readiness audit inspects the website. A visibility observation records an answer from an external service. A business measurement records what visitors and customers actually do. A useful program connects those records without merging them into one score.
| Measurement layer | Main question | Useful evidence | Common reporting mistake |
|---|---|---|---|
| Website readiness | Are important public pages accessible and understandable? | Crawl responses, content checks, directives, and page evidence | Calling an audit score an AI ranking |
| Observed visibility | Does the business appear for the selected questions? | Saved answers, citations, conditions, and timestamps | Treating one answer as stable market share |
| Business outcomes | Does discovery produce useful activity? | Referrals, qualified inquiries, sales, and customer feedback | Assuming every mention caused revenue |
An improvement at one layer may not produce an immediate improvement at another. A developer can fix a broken public page without changing a sampled answer that week. A business can receive an accurate mention without receiving a visit. A referral can generate a lead that does not become a suitable customer.
Write a goal statement that names the layer. “Reduce confirmed access failures on priority pages” is a readiness goal. “Increase observed citation coverage for implementation questions in our sample” is a visibility goal. “Increase qualified inquiries from measurable assistant referrals” is a business goal.
Use published data to understand the problem, not predict your result
Ahrefs published a February 2026 analysis of 300,000 keywords, split into 150,000 with AI Overviews and 150,000 informational keywords without them. Its December 2025 data associated AI Overviews with 58% lower average clickthrough rate for the top-ranking page, using the study’s comparison method. This is an observational Google-search result, not a forecast for ChatGPT referrals or your website. Read the Ahrefs methodology.
The reporting lesson is to preserve the outcome being measured. Clickthrough rate, source selection, recommendation inclusion, and revenue are different outcomes. A headline about one outcome should not be placed beside a dashboard for another as though the numbers measure the same phenomenon.
Date the research you use. A historical study can remain useful while no longer describing the current environment. State the observation period, product, population, and important limitations. If a later study uses a different method, show that difference rather than presenting a clean trend line that the underlying data cannot support.
Define exactly what counts as a success
Before collecting answers, write operational definitions. A mention can mean the exact brand name, an accepted variation, or a product name tied to the business. A citation can mean a visible link to the owned domain. A recommendation can mean inclusion in a relevant shortlist with a positive reason. Choose definitions that a second reviewer can apply consistently.
Do not silently count a negative mention as a favorable recommendation. An answer that says a product does not support the requested integration may contain the brand name and a website link while discouraging the user from choosing it. A mention count alone would miss that distinction.
A simple outcome dictionary
- Brand mention: the answer identifies the business or an approved brand variation.
- Owned-domain citation: the answer links to a page on the business’s own domain.
- Relevant recommendation: the answer presents the business as a suitable option for the stated need.
- Factual accuracy: the answer’s material statements match verified public facts.
- Qualified referral: a measured visit meets the organization’s documented relevance criteria.
- Qualified inquiry: the contact meets a separately defined commercial qualification rule.
Record ambiguous cases instead of forcing a judgment. A link to an unrelated company with a similar name is not a successful citation. A broken citation should be visible in the report. An unclear recommendation should be marked for review rather than counted as a win by default.
Build a question set from customer needs
A question set should reflect what prospective customers need to decide. Start with real inquiries, product questions, and relevant market situations. Include buying constraints such as team size, location, budget structure, required integrations, and implementation needs when those constraints matter to the offer.
Keep branded and unbranded questions in separate groups. “What is the website for Example Calendar?” measures something different from “Which scheduling tools support travel buffers for maintenance teams?” Mixing the two can make a brand appear discoverable because it answers requests that already contain its name.
Choose a manageable starter design
A worked starter design might use 20 questions, three services, and three observation rounds. That creates 180 planned answer observations, because 20 × 3 × 3 = 180. This is a workload example, not a statistically representative sample of every question customers could ask.
| Question group | Number of questions in the example | Reason to include it |
|---|---|---|
| Problem explanation | 5 | Tests whether useful educational material is visible |
| Product or service fit | 5 | Tests relevance to a customer’s constraints |
| Comparison | 5 | Tests whether the offer appears in an evaluation context |
| Implementation and purchase preparation | 5 | Tests questions near a practical next step |
Keep the questions stable during a comparison period. Add new questions to a separate cohort rather than replacing difficult questions with easier ones. Record the origin and intended audience of each question so future reviewers understand why it belongs in the sample.
Document the conditions of every observation
The same words can produce different answers under different conditions. Record the service, visible mode, search availability, account state, language, region when known, date, and exact prompt. If a setting is unknown or cannot be controlled, record that limitation explicitly.
A new conversation can reduce some carryover from earlier exchanges, but it does not establish that every other form of personalization or system variation has disappeared. Avoid calling a test “fully neutral” unless you can define and support that claim. Describing the actual conditions is more useful than an absolute label.
Minimum observation fields
| Field | Example value | Why the field matters |
|---|---|---|
| Question ID | FIT-03 | Connects repeated observations to the same question |
| Exact prompt | Stored verbatim | Prevents accidental wording changes |
| Service and mode | Recorded as displayed | Distinguishes different answer environments |
| Timestamp | ISO date and time | Makes later comparison possible |
| Search state | Available, used, unavailable, or unknown | Prevents assumptions about retrieval |
| Brand mention | Yes, no, or ambiguous | Preserves the definition used |
| Owned citation URLs | Full observed links | Enables source verification |
| Recommendation quality | Relevant, unsuitable, or unclear | Adds context beyond a name count |
| Notes | Error, challenge, or unexpected condition | Keeps exceptions visible |
Save the evidence in a format the team can review. A screenshot helps preserve presentation, but copied answer text and citation destinations make detailed checking easier. Apply your organization’s data-handling rules and avoid storing private account information or unnecessary personal data.
Calculate rates with an honest denominator
A rate is meaningful only when its denominator is clear. If a planned run fails, decide whether the metric reports completed answers, planned attempts, or another population. Report completion separately so a high success rate among a small successful subset cannot hide missing observations.
Imagine the starter plan produces 180 attempts, of which 168 return usable answers and 12 fail or remain unavailable. The completion rate is 168 ÷ 180 = 93.3%. If 42 usable answers include an owned-domain citation, citation coverage among usable answers is 42 ÷ 168 = 25%. Relative to all planned attempts, the same 42 citations represent 23.3%.
All numbers in that example are hypothetical. The point is that both denominators can be reported honestly when labeled. A misleading report would publish “25% coverage” without explaining that some planned answers were missing, or compare it with another period that used all attempts as the denominator.
Define the main formulas
- Completion rate: usable answer observations divided by planned attempts.
- Mention coverage: usable observations containing the defined brand mention divided by usable observations.
- Citation coverage: usable observations containing an owned-domain citation divided by usable observations.
- Recommendation coverage: usable observations containing a relevant recommendation divided by usable observations.
- Citation accuracy rate: checked citations that resolve to the intended source divided by citations checked.
Round consistently and retain the counts behind the percentages. A report showing “42 of 168” lets a reviewer reconstruct the result. A report showing only “25%” removes information needed to judge the sample and notice changes in scope.
Distinguish percentage points from relative change
Percentage-point change subtracts two percentages. Relative change divides the difference by the starting value. Confusing those calculations makes modest improvements sound much larger or turns a meaningful decline into an unclear statement.
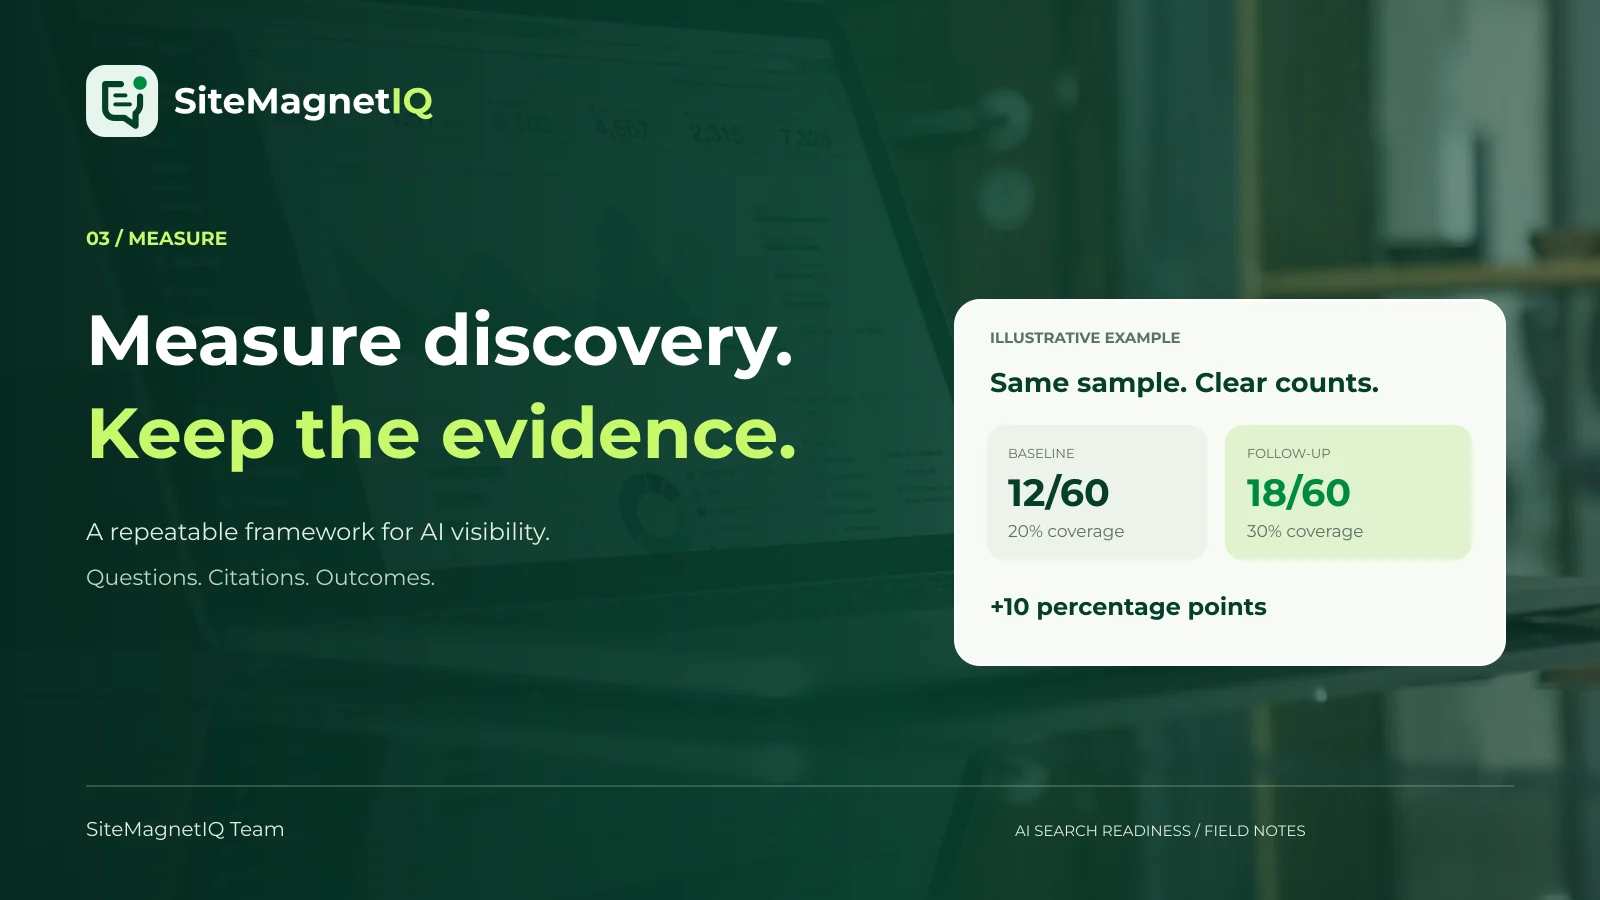
For a hypothetical fixed set of 60 usable observations, suppose citations rise from 12 to 18. Coverage rises from 20% to 30%. The change is 10 percentage points and 50% relative growth. Both calculations describe the same six additional citation observations, but the language creates a different impression.
| Hypothetical measure | Baseline | Follow-up | Correct description |
|---|---|---|---|
| Usable observations | 60 | 60 | Denominator stayed constant |
| Observations with citations | 12 | 18 | Six additional citation observations |
| Citation coverage | 20% | 30% | Increase of 10 percentage points |
| Relative change | — | 50% | Relative increase from the original coverage |
Do not describe the change as “50 percentage points.” Do not describe it as a 50% revenue increase. The example measures observed citation coverage, and nothing in the arithmetic establishes a business outcome or a causal effect from a website edit.
Keep provider and intent breakdowns visible
An aggregate can hide the differences that matter most. Coverage may increase for educational questions while declining for purchase-related questions. One service may produce most of the citations. A changed mix of questions can raise the total without improving performance within any stable group.
Report at least the service and intent group when the sample supports a useful breakdown. Show counts as well as rates. If a segment contains very few observations, state that limitation rather than treating a large percentage swing as a reliable directional signal.
Use weights only when the business can explain them
A business may care more about buying questions than definitions. If the team chooses a weighted summary, publish the weights before interpreting results. For example, assigning 50% of a summary to product-fit questions and 25% each to comparison and implementation questions is a planning decision. Those weights are not a universal industry standard.
Preserve the unweighted results beside any weighted number. Otherwise, a future stakeholder cannot tell whether a score changed because answers changed or because the team changed the formula. Avoid comparing weighted summaries from different agencies unless their underlying definitions, samples, and weighting rules match.
Inspect the quality of the mention, not just its presence
A business can appear prominently in an inaccurate or unsuitable answer. Check the stated capabilities, operating area, product name, pricing description, and limitations when those facts influence the recommendation. The quality review should focus on material differences a customer would care about.
Open citation links and confirm that they support the associated claim. A homepage link does not necessarily substantiate a specific integration or performance statement. A citation to an old comparison page may preserve information that the business has already changed elsewhere. Record the exact mismatch so the response can guide useful content maintenance.
A second reviewer can help expose ambiguous definitions. Ask reviewers to classify a small shared set independently, then compare disagreements. The purpose is to improve the rubric, not manufacture a formal reliability statistic from an informal exercise. Keep unresolved cases visible in the final report.
When a claim is wrong, correct inaccurate public source material where you control it and document the change. Do not assume the answer will update immediately or that a particular correction channel will produce a guaranteed result. Treat the issue as a factual maintenance task and continue observing.
Combine visibility observations with referral evidence
Referral analytics can show measurable visits, but analytics is not a complete record of every influence on a customer. Some users may return later through another route, copy a URL, use a browser that limits information, or contact the business without a tracked click. A missing referral label does not prove that no AI interaction occurred.
At the same time, a visit labeled with an assistant-related source is not proof of a recommendation. A person may have asked for an existing brand’s website. A researcher may have opened a citation without any buying interest. Review the landing page and downstream behavior before assigning commercial meaning.
A practical outcome ladder
- Observe the answer and verify what it says.
- Confirm whether an owned-domain source is linked.
- Record measurable visits using the analytics setup available to the business.
- Check whether those visitors reach relevant pages or complete useful actions.
- Qualify inquiries using the same criteria applied to other channels.
- Connect confirmed customers to the available evidence without overstating attribution.
Keep raw traffic, qualified inquiries, and confirmed customers in separate rows. An increase in visits can coexist with lower lead quality. A small number of relevant visits can be commercially useful. Interpret the outcome in the context of the business rather than assuming more mentions always means more value.
Avoid claiming causation from a simple before-and-after chart
A website edit can occur alongside many other changes. The assistant may update, search availability may change, competitors may publish new material, public coverage may appear, and the question mix may shift. A higher coverage rate after an edit does not, by itself, prove that the edit caused the increase.
Maintain a deployment and events log. Record which URLs changed, what changed, when the change became public, and why the team made it. Note external events that could plausibly affect the observations. A useful log includes uncertainty rather than trying to explain every result after the fact.
Keep observation conditions and cohorts stable where practical. When a service changes its visible mode or behavior, annotate the comparison. Do not quietly join incompatible data into a single trend. If the measurement process materially changes, start a new labeled series and retain the old one for context.
Formal experiments require a design suited to the question and enough information to support an inference. Repeated answers can be correlated, and a convenience set of prompts is not a random sample of all customer demand. Do not attach conventional statistical certainty to repeated outputs without examining those assumptions.
Build a reporting rhythm that leads to decisions
Choose a cadence the team can sustain and justify. A small organization might review a stable question cohort monthly and revisit website findings after material changes. A fast-moving launch might need a shorter observation interval. Neither cadence is a universal rule, and checking more frequently does not automatically make the measurement better.
A useful report can fit its conclusions on one page while preserving detailed evidence elsewhere. State the scope, completion rate, key segment results, important inaccuracies, related website changes, and the next decisions. Include the counts and definitions that make the summary auditable.
End with specific actions
- Fix an incorrect public product fact that appears in cited material.
- Improve a missing explanation for a recurring customer question.
- Investigate a relevant page that repeatedly fails retrieval checks.
- Clarify an ambiguous scoring definition before the next measurement round.
- Review a segment whose apparent improvement depends on a very small sample.
- Investigate whether measured referrals produce suitable inquiries.
An evidence-led action is more useful than a celebratory score without context. The goal is to make better website and marketing decisions, not maintain an uninterrupted upward line on a dashboard.
How to use SiteMagnetIQ alongside this process
SiteMagnetIQ supports the readiness layer through checks of public-page access, content structure, context, attribution, and structured data. Findings provide affected URLs and recommended changes, and saved audit reports can be shared as PDFs. Those records help explain what the team observed on the website and what it chose to fix.
The current product does not query ChatGPT, Claude, or Gemini for live mention or citation tracking. Use a separate observation log or an appropriately evaluated measurement service for that layer. A SiteMagnetIQ readiness score should never be relabeled as share of voice or recommendation probability.
Connect the records using URLs, dates, and decisions. An audit can identify a weak explanation. An editor can improve that explanation. A deployment log can show when the new text became public. A later observation can show whether the page was cited in the selected sample. Keeping each step distinct preserves what the evidence actually establishes.
If the underlying website still needs work, follow the 30-day readiness checklist. If the team is unsure what absence means, start with the diagnosis of missing ChatGPT recommendations. Measurement is most useful when the team knows which decision it is trying to make.
Frequently asked questions
Can one prompt tell me whether my business is visible in AI search?
One prompt records one answer under particular conditions. It can reveal a useful factual issue, but it does not describe all relevant customer questions or establish a stable recommendation position. Use a defined cohort and preserve the individual observations.
Should failed observations count as missing mentions?
Report failed attempts separately from usable answers. You may calculate a rate against all planned attempts or against completed observations, but label the denominator and show completion. Do not change denominator rules between periods without explaining the effect.
Is share of voice the same as citation coverage?
Citation coverage describes how often the defined observation set includes a citation to your domain. Share-of-voice metrics depend on the tool’s competitor set, counted events, and denominator. Compare definitions before assuming two reports measure the same thing.
Does more AI referral traffic always mean better performance?
More referral traffic means more measured visits under the analytics setup used. Commercial performance depends on relevance, qualified inquiries, customer fit, and subsequent outcomes. Review those measures separately before deciding that the channel is improving.
How should I present a small sample to a client?
Describe the sample directly, show counts, and avoid market-wide conclusions. State which questions, services, rounds, and conditions were included. Explain that the results represent those observations and identify the additional evidence needed for a stronger decision.
Sources and research notes
- Ahrefs: AI Overviews clickthrough analysis update, February 2026. Historical observational research using the stated Google-search keyword samples; not an experiment on SiteMagnetIQ customers or ChatGPT traffic.
- Google: AI features and your website. Google documents that its AI-feature traffic is included in overall Search Console web reporting, which matters when interpreting channel-specific claims.
The question cohorts, observation counts, percentages, weighting examples, and workflow tables in this article are original illustrative examples. They are not published customer outcomes or a statistical guarantee. The guide’s measurement recommendations are an editorial framework; teams should adapt the design to their actual questions, data quality, and analytical expertise.

Written by SiteMagnetIQ Team
Practical website guidance with clear sources, explicit limits, and actionable next steps.
About our editorial approach ↗